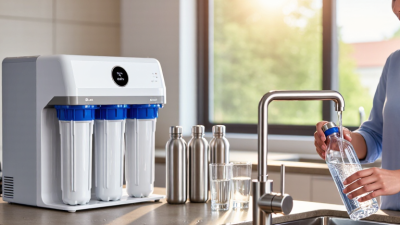
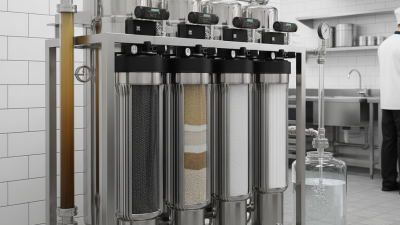
Commercial water treatment is entering a more demanding decade. The 2026 Top Commercial Water Filtration System Buying Guide examines equipment beyond simple flow-rate comparisons. Restaurants, hotels, clinics, factories, and offices face different contaminants, operating hours, and maintenance risks.
The U.S. Environmental Protection Agency’s 7th Drinking Water Infrastructure Needs Survey estimates $625 billion in drinking water infrastructure needs over 20 years. That figure highlights a practical reality: water quality depends on treatment equipment and aging distribution systems. The WHO and UNICEF Joint Monitoring Programme also continues to report major global gaps in safely managed drinking water. Reliable filtration therefore requires verified performance, not attractive product language.
This guide evaluates a commercial water filtration system through measurable criteria. These include source-water testing, contaminant reduction claims, peak demand, pressure loss, replacement intervals, sanitation, and total ownership cost. NSF/ANSI standards can help buyers verify material safety and treatment claims. The Water Quality Association and AWWA also provide useful technical guidance for professional planning.
Details matter. A busy café may need stable flow during a morning rush. A hospital kitchen may require stricter monitoring and documented maintenance. A manufacturing line may prioritize scale control and process consistency. There is no universal configuration. That is easy to overlook.
Some market forecasts predict rapid growth in commercial filtration, but their methods and assumptions differ. Treat them carefully. Independent laboratory reports, local water-quality data, and qualified installer experience deserve greater weight. This guide aims to support informed decisions, while acknowledging one limitation: even a well-researched recommendation can fail without disciplined maintenance and regular performance checks.
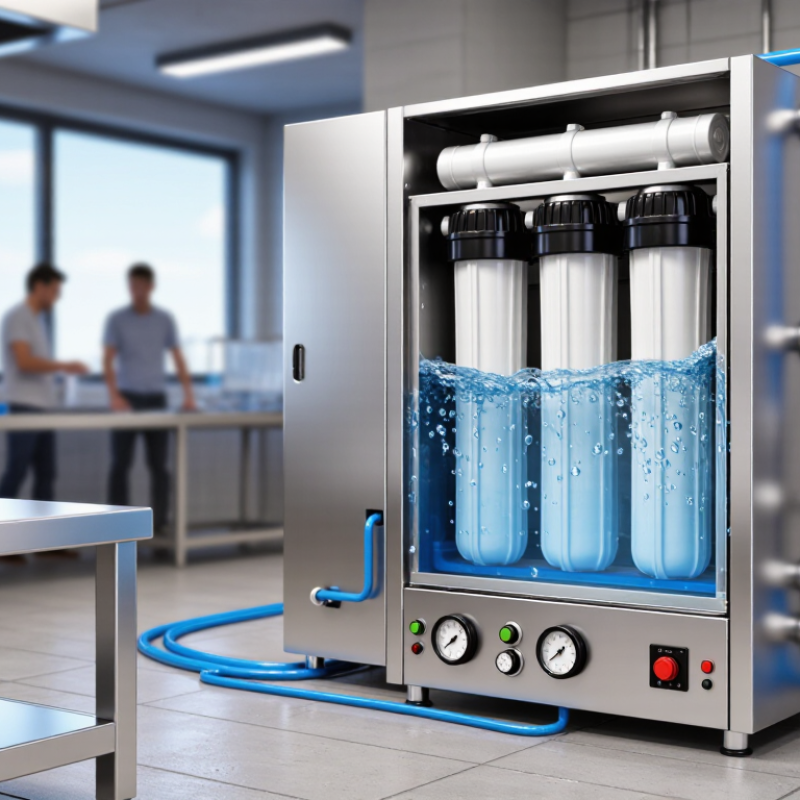
Choosing a commercial water filtration system starts with the water report, not the equipment catalog. EPA Maximum Contaminant Levels, or MCLs, provide health-based limits for regulated contaminants in public drinking water. They are useful reference points, but they do not describe every building or private source. A restaurant may receive compliant water, then find lead at a seldom-used tap. Test the incoming line and the point of use when conditions differ. Record sampling dates, methods, and detection limits.
NSF/ANSI 42 focuses on aesthetic concerns, such as chlorine taste, odor, and particulate reduction. NSF/ANSI 53 covers specific health-effect claims, including certain lead or cyst reductions. NSF/ANSI 58 applies to reverse osmosis systems and their certified reduction claims. Certification is not a blanket promise. Check the exact contaminant, rated capacity, flow rate, pressure range, and replacement schedule. A common buying error is matching a filter to a contaminant name without reading its performance data sheet. I have seen that shortcut create expensive maintenance problems. It feels efficient. It is not always reliable. Compare the certified claim with the laboratory report, then consider water temperature, peak demand, and drain requirements. An undersized system can deliver acceptable water slowly, while an oversized system may waste budget and receive poor maintenance. Recheck the assumptions.
A commercial water filtration system should be sized from demand, not pipe diameter.
The U.S. Environmental Protection Agency’s WaterSense at Work report states that commercial and institutional facilities represent about 17% of public water supply demand. That demand varies sharply by facility type. A hotel, clinic, restaurant, and factory can share the same daily volume but require very different peak flows.
Convert demand into three numbers. Daily volume equals users multiplied by consumption per user.
For example, 180 occupants using 18 gallons each creates 3,240 gallons per day.
Peak-hour capacity needs a separate calculation. If 30% of that volume occurs during a three-hour rush, the average peak flow is 3.24 GPM.
Add a practical design margin, such as 25%, and the target becomes about 4.1 GPM.
This is only a starting point. The American Society of Plumbing Engineers recommends using fixture-unit methods and probability-based demand curves, rather than simply adding every fixture’s rated flow.
A neat spreadsheet can still be wrong.
Staff schedules, process rinsing, seasonal occupancy, and backwashing may change the real load. I would record at least seven days of meter data before final sizing.
Also check pressure loss, media loading, water temperature, and the required treatment standard. NSF/ANSI standards can support component selection, but certification does not replace site testing.
Oversizing may increase stagnation and operating cost; undersizing creates pressure loss when demand matters most.
Choosing a commercial water filtration system starts with understanding micron rating and log removal. Micron size describes particle separation, not complete microbial protection.
MF commonly ranges from 0.1 to 10 microns. It can reduce suspended solids and many larger bacteria, but performance varies with pore size and water quality.
UF operates around 0.01 to 0.1 microns, often improving bacterial and protozoan control. Virus removal may remain limited.
RO has a much tighter barrier, near 0.0001 microns, and can reduce dissolved salts, metals, and many microorganisms. It needs pressure and produces reject water.
UV is different. It has no micron rating.
Instead, it delivers light energy that inactivates microorganisms after adequate exposure. Clear water matters. Turbidity, lamp age, flow speed, and scaling can weaken the actual dose. A system claiming four-log removal still requires verified operating conditions.
During site evaluations, I would compare test data, flow rate, pressure, maintenance records, and target contaminants together. A filter’s smallest number can look impressive. It may still fail when overloaded or poorly maintained.
I would also question whether “removal” means physical separation or disinfection. That distinction is easy to miss.
Detection limits and changing source-water conditions deserve attention, because published performance rarely matches every installation perfectly.
2026 Top Commercial Water Filtration System Buying Guide
For commercial buyers, reverse osmosis performance should be measured, not assumed. A reliable system may achieve 95–99% TDS rejection under suitable operating conditions. Feedwater temperature, pressure, membrane age, and pretreatment all affect the result. Numbers need context. A 98% rejection rate sounds impressive, but unstable pressure can reduce daily output and water quality. During commissioning, record feed TDS, permeate TDS, flow rate, temperature, and recovery. These readings create a practical baseline for future maintenance.
Recovery shows how efficiently the system uses incoming water. Higher recovery can reduce waste, but it may increase scaling risk without proper pretreatment. Commercial systems often require sediment filtration, carbon treatment, and hardness control before the RO stage. The best target depends on feedwater chemistry and operating costs. Test under load. Laboratory results may not match a busy production schedule. I have seen clean performance reports weaken after several weeks because operators delayed filter replacement. Small errors matter.
Tips: Ask for rejection and recovery data at clearly stated conditions. Check whether the test uses your actual feedwater profile. Review cleaning intervals, pressure limits, and monitoring points before purchase. Keep spare prefilters available, especially where water demand changes sharply. A simple logbook can reveal declining membrane performance before product quality is affected. Some specifications remain estimates, so confirm them through site testing and independent water analysis.
Benchmark RO performance at 95–99% TDS rejection and practical recovery levels.
The benchmark compares common commercial reverse osmosis operating points. TDS rejection represents the percentage of dissolved solids removed from feed water, while recovery represents the percentage of feed water converted to permeate. Actual results vary with feed-water chemistry, temperature, pressure, membrane condition, and pretreatment quality.
A commercial water filtration system should be judged by lifecycle cost, not its purchase price. The EPA’s 2023 Drinking Water Infrastructure Needs Survey estimates U.S. drinking-water infrastructure needs at $625 billion through 2040. That figure shows why planned maintenance matters. Record cartridge prices, labor hours, membrane replacement, wastewater, electricity, and disposal fees in one spreadsheet. A cheap unit can become expensive after repeated shutdowns.
Maintenance should be visible at the installation point. Include pressure gauges, isolation valves, sample ports, and a written replacement schedule. Check pressure drop weekly during busy periods. Keep service records with dates, flow rates, and water-quality results. The WHO Guidelines for Drinking-water Quality, 2022, supports risk-based monitoring rather than relying on equipment claims alone. I would not trust a certificate without checking its exact scope. It may cover materials, but not every contaminant claim.
For 2026 purchasing, verify applicable NSF/ANSI certifications. NSF/ANSI 42 generally covers aesthetic effects, while NSF/ANSI 53 addresses specific health-related contaminants. Reverse-osmosis systems may require NSF/ANSI 58. Components contacting drinking water may need NSF/ANSI/CAN 61, and lead-content compliance may involve NSF/ANSI/CAN 372. Requirements still vary by country, state, building use, and tender documents. Ask for current certificates, test conditions, renewal dates, and the certified model configuration. A spreadsheet can still lie. Include one realistic failure scenario: a clogged prefilter during the busiest lunch service.
| System Type | Typical Commercial Use | Typical Flow Rate | Typical Purchase Cost1 | Estimated Annual Maintenance1 | Estimated 5-Year TCO1 | Main Contaminant Reduction | Maintenance Profile | Relevant 2026 Certification or Compliance Checks | Lifecycle Buying Considerations |
|---|---|---|---|---|---|---|---|---|---|
| Sediment Filtration | Pre-treatment for buildings, food service, process water, and point-of-entry systems | 10–100 gpm | $1,000–$8,000 | $500–$3,000 | $3,000–$23,000 | Sand, rust, silt, suspended solids, and particulate matter | Inspect differential pressure; replace or backwash media when pressure loss or turbidity rises | Verify NSF/ANSI/CAN 61 for wetted components where required; confirm local plumbing and backflow requirements | Low operating complexity; select a vessel with adequate empty-bed contact area and accessible pressure gauges |
| Activated Carbon | Restaurants, hospitality, offices, beverage service, and taste-and-odor treatment | 5–50 gpm | $2,000–$15,000 | $1,000–$7,000 | $6,000–$43,000 | Chlorine, taste, odor, and selected organic compounds; performance depends on carbon type and contact time | Replace cartridges or carbon media based on capacity, chlorine breakthrough, pressure drop, and water testing | Look for NSF/ANSI 42 claims for aesthetic effects; NSF/ANSI 53 only when the specific health-effect claim is certified | Do not size only by peak flow; insufficient contact time can reduce contaminant removal and shorten media life |
| Water Softener | Laundry, boilers, dishwashing, food service, and facilities with hard water | 5–100 gpm | $2,500–$18,000 | $1,200–$6,000 | $8,500–$48,000 | Calcium and magnesium hardness; does not generally remove dissolved salts or disinfect water | Add salt, inspect brine tank, check regeneration settings, and test hardness at the outlet | Check NSF/ANSI/CAN 44 certification for residential-type cation-exchange softeners where applicable; commercial installations may follow local rules | Include salt, water, sewer, and electricity use in TCO; confirm drain and brine-discharge requirements before installation |
| Ultrafiltration (UF) | Drinking-water polishing, food processing, and applications requiring particulate and microorganism reduction | 2–50 gpm | $8,000–$60,000 | $3,000–$18,000 | $20,000–$132,000 | Suspended solids, colloids, bacteria, and some cysts, depending on validated membrane performance | Monitor transmembrane pressure, perform backwash or chemical cleaning, and replace modules according to integrity and performance data | Verify the exact NSF/ANSI 53 or NSF/ANSI 58 claim only when applicable; confirm microbiological validation and local health-authority acceptance | Requires trained operators and a defined cleaning protocol; pretreatment quality strongly affects membrane life |
| Reverse Osmosis (RO) | Food and beverage production, laboratories, medical support areas, hospitality, and high-purity process water | 0.5–100 gpm permeate | $10,000–$100,000 | $4,000–$30,000 | $30,000–$250,000 | Dissolved salts, many metals, nitrate, fluoride, and other dissolved constituents; removal varies by membrane and operating conditions | Replace pretreatment cartridges, monitor conductivity and recovery, sanitize tanks, and clean or replace membranes | Check NSF/ANSI 58 for certified RO systems and exact reduction claims; verify NSF/ANSI/CAN 61 materials and electrical safety listing as required | Account for concentrate disposal, feed-water pressure, booster-pump energy, storage, and recovery rate—not just equipment price |
| Ultraviolet (UV) Disinfection | Final microbial control for drinking water, process water, and facilities using private or treated sources | 5–200 gpm | $3,000–$35,000 | $800–$6,000 | $7,000–$59,000 | Inactivates bacteria, viruses, and protozoa when the validated UV dose is delivered; it does not remove chemicals or particles | Replace lamps on the specified schedule, clean quartz sleeves, verify UV intensity, and maintain prefiltration | Check NSF/ANSI 55 Class A or Class B applicability; Class A is intended for microbiologically safe drinking water treatment | Turbidity and UV transmittance can reduce delivered dose; install alarms, flow controls, and a validated dose-monitoring system where needed |
| Chemical-Free Iron and Manganese Filtration | Commercial buildings and facilities using groundwater with staining, metallic taste, or elevated iron and manganese | 5–80 gpm | $3,000–$25,000 | $1,000–$8,000 | $8,000–$65,000 | Iron and manganese within the certified operating range; results depend on pH, oxidation state, and competing contaminants | Backwash media, inspect valves, test treated water, and replace media when capacity or pressure performance declines | Verify performance data for the exact influent chemistry; confirm NSF/ANSI/CAN 61 materials and local discharge requirements | Obtain a laboratory water analysis before selection; pH, dissolved oxygen, sulfur, and iron form can materially change results |
Cost and compliance notes:
1 Cost ranges are planning estimates in 2026 U.S. dollars for commercial installations. Actual pricing varies with flow, water chemistry, site conditions, controls, labor, permits, storage, electrical work, and regional service rates. The estimated five-year total cost of ownership includes purchase cost plus four years of estimated maintenance; it excludes major building modifications, financing, taxes, and water/sewer charges unless specifically stated.
Certification requirements are application- and jurisdiction-dependent. Confirm current requirements with the authority having jurisdiction, the local plumbing or health department, and the project engineer before purchase. Certification to a standard does not automatically certify every contaminant-reduction claim.
For a 2026 procurement review, request current third-party certification documentation, the exact model number, certified reduction claims, operating limits, installation instructions, replacement-part availability, warranty terms, service intervals, and a documented water-analysis report.
Build your system. Protect your boat. Join the movement.